
1757 阅读 2020-02-10 14:35:19 上传
Acoustical characteristics of vocal modes in singing
Eddy B. Brixen1, Cathrine Sadolin2, and Henrik Kjelin3
1EBB-consult, Smorum, DK-2765 Denmark
ebb@ebb-consult.com
2Complete Vocal Institute, Copenhagen, DK-1128 Denmark
cathrine@sadolin.net
3Complete Vocal Institute, DK-1128 Denmark
kjelin@shout.dk
ABSTRACT
According to the Complete Vocal Technique four vocal modes are defined: Neutral, Curbing, Overdrive, and Edge. These modes are valid for both the singing voice and the speaking voice. The modes are clearly identified both from listening and from visual laryngograph inspection of the vocal cords and the surrounding area of the vocal tract. In a recent work a model has been described to distinguish between the modes based on acoustical analysis. This paper looks further into the characteristics of the voice modes in singing in order to test the model already provided. The conclusion is that the model is too simple to cover the full range. The work has also provided information on singers’ SPL and formants’ repositioning in dependence of pitch. Further work is recommended.
1. INTRODUCTION
1.1. Complete Vocal Technique, CVT
Complete Vocal Technique, CVT, is developed by Cathrine Sadolin over a period of 25 years. This work has been done in an attempt to encompass all sounds the human voice can produce in one singing technique model that will comply with knowledge from medical and acoustic science [1], [2]. Also that the model to a large extend cover the speaking voice.
1.2. Vocal modes
A vital part of Complete Vocal Technique is the categorizing of any voice sound into one of four vocal modes which have different characteristics of sound, individual limitations according to pitch and vowel sounds, and different settings of the vocal tract.
The four vocal modes are:
Neutral - which is a 'non-metallic' usually softly characterized sound that might have a breathy quality to it.
Curbing - which is a 'half-metallic' slightly plaintive or restrained sound quality.
Overdrive - which is a 'full-metallic' - often direct and loud - sound with a more shout like character.
Edge - which is a 'full-metallic' light somewhat aggressive sound with a more screamy character. (This mode was formerly known as “Belting”).
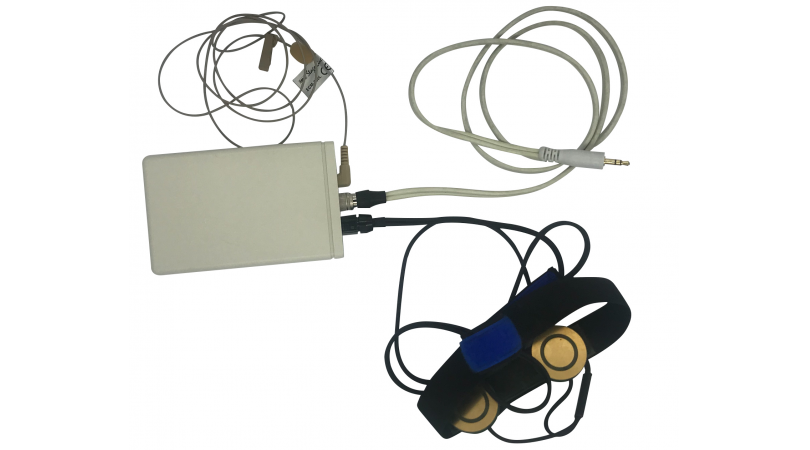
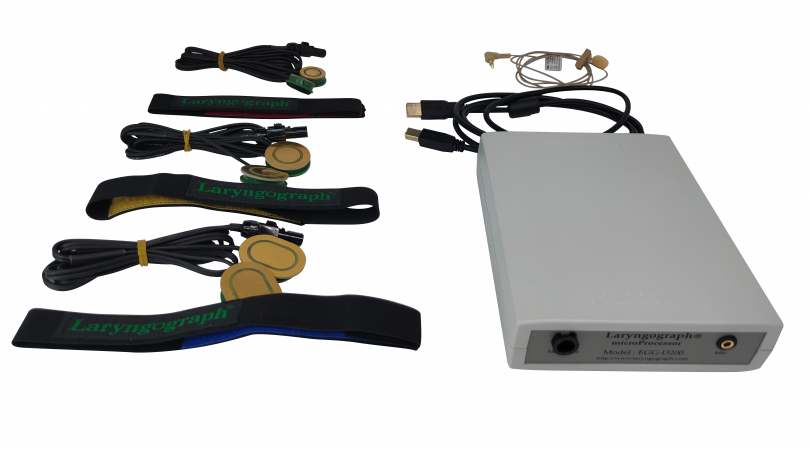
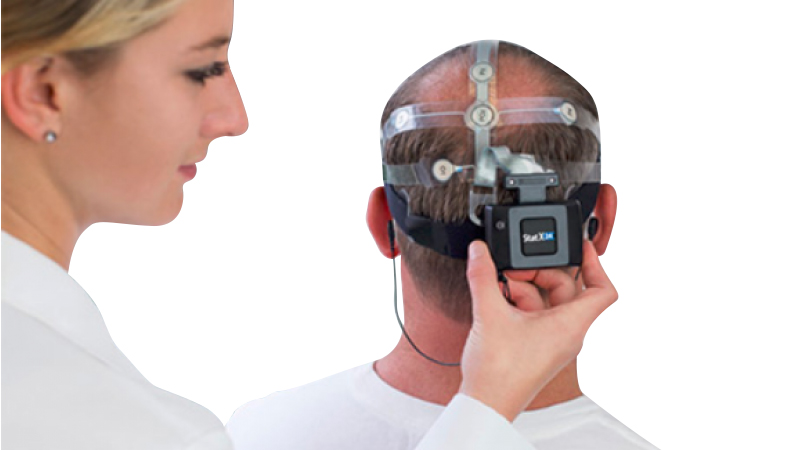
These modes are clearly identified both from listening and from visual laryngograph inspection of the vocal cords and the surrounding area of the vocal tract.
Also the modes to a large extent can be recognized visually from laryngograph waveform recordings.
However, until now there has not been presented any analysis on the frequency distribution of these modes. So for this and many other reasons (for instance creating vocal mode/training apps) it would be preferred to establish and apply the simplest possible acoustic analysis to identify the vocal modes. This could be used as a tool in the training and as definition of mode parameters.
1.2.1. Vocal modes vs. singer’s formant
Since Wilmer T. Bartholomew in 1934 published his work on vocal efforts in singing: “Physical Definition of ‘Good Voice-Quality’ in the Male Voice” [3], much research has been done in that field. Most work has been related to classical singing. Johan Sundberg has provided consistent and important knowledge. He has identified and explained the phenomenon called “singer’s formant” [4], [5], [6], [7], [8] sometimes also known as “voice ring”. Others have followed with similar research [9], [10]. Initially this emphasis of frequencies in the 2.2-3.1 kHz range was only related to opera singers. However, it also has also been identified in the voice of singers performing other musical genres than classical singing as well as in the speaking voice [11], [12], [13], [14].
Basically the singer’s formant is found to be a boost of the frequency band around 3 kHz. This is done by the aid of a resonator formed just above the vocal folds, between the glottis and the rim of the epiglottis.
In newer research it has been suggested that a second singer’s formant can be found in the frequency range of 7.8 – 8.2 kHz [15], [16]. It has not yet been identified in which part of the vocal tract that provides this resonance.
The CVT emphasize the importance of separating technique from musical style and personal taste, and while the sound of the singer’s formant is widely preferred in classical singing, there are many other styles of music where this sound is not perceived as appropriate. So the CVT is not directly aiming for singer’s formant in the classical understanding of it. However, the vocal modes are basically identified using the same analysis methodology as previously has been used for the identification of the singer’s formants and the major impact of the various vocal modes are observed in the same frequency ranges as the singer’s formant is found.
1.2.2. Chest voice/ head voice/mixed voice
The terminology used to describe the quality of the singing voice remains problematic. Terms such as ‘chest voice’, ‘head voice’ and ‘mixed voice’ are widely used but not defined precisely. Originally the terms were used to describe a range of pitch, and did not necessarily refer to specific sound qualities. Chest voice is lower notes, and head voice is higher notes. A sound is produced in 'chest voice' when the singer can feel a resonance in the breastbone (sternum), chest resonance, which occur when singing lower notes. When singing higher notes the breastbone does not resonate, and many singers have instead a sensation of resonance in the head, hence the term 'head voice'. The interpretations of the terms have over the years developed simultaneously in multiple ways, and today many voice professionals interpret 'chest voice' and 'head voice' as a certain sound quality regardless of pitch. This is confusing, partly because of the different interpretations of the terms, and partly because the chest resonance does not take place at higher notes no matter the sound quality used.
Other examples of insufficient defined terminology widely used to describe the singing voice are: Projection, placement, natural voice, falsetto, voix mix, focused voice, singing in the mask, etc.
Due to these discrepancies introduced in the CVT-training.these terms are not introduced in the CVT-training.
1.3. Automatic voice analysis
It was previously mentioned that the current work is to be regarded primarily as a documentation of the CVT. However, it also could become the basis for a simple feedback system for the singers although it is well known that feed-back systems and systems for automatic voice analyses have been discussed, introduced, and used for a long period of time.
In [17] Howard et al. discuss the use of real-time displays in the singing studio.
In [18] Winkel expand his already introduced analysis device to include the analysis of vibrato (1976).
In [19] Zwan present his research for the design of an expert system for automatic quality assessment of singing voices. It is based on a large number of voice samples (untrained and trained classical singers). A number of parameters are extracted from the samples forming feature vectors used to train a neural network. The automatic system was tested against experts’ assessment of the same set of voice samples.
In [20] Zwan and Kostek go further in detail regarding the results. In [21] a web presentation of this research can be found.
In [22] Mayor, Bonada, and Loscos outline a system that provides feedback to the singer. The intention behind this system is to provide the same kind of feedback as the singers’ teacher would do. This system uses intra-note segmentation. It provides not only information on pitch but also timing and level. The implementation of visual feedback is discussed.
In [23] it was shown that a simple discrimination of the individual modes is possible based on 1/3 octave band analysis and a comparison between signal energy in groups of frequency bands. The vocal modes were detected from different individuals singing at the same pitch (male: C4, female: B4 (scientific scale)) and a given vowel (Neutral and Curbing: E; Overdrive and Edge: EH), providing a sufficient number of formants. This is however rather limited in relation to singers’ pitch range and available vowels.
This paper describes the further work. An extended experiment has been carried out. Here a number of four singers have been recorded and analyzed.
The goal has been to investigate how well the simple model can provide sufficient results. It is known that not all modes apply to the full voice range. Also it is known, that the modes not equally fits all vowels.
Beside the primary results some “bonus” information has been established regarding the sound pressure level that singers produce when singing scales and applying the various vocal modes. Further, some observations regarding repositioning of formants (especially F1) as a function of pitch have been made.
2. SET-UP FOR THE STUDY
2.1. Subjects
For this study a number of four singers were recorded and analyzed: Two male and two female singers. All singers were familiar with the CVT principles.
2.2. Recording
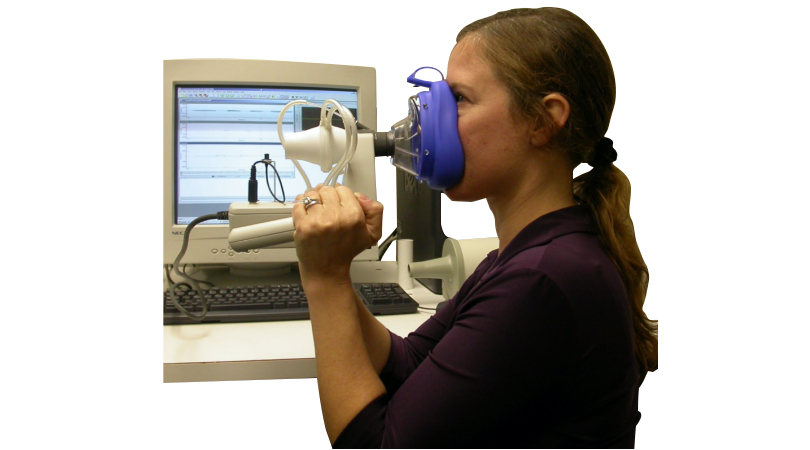
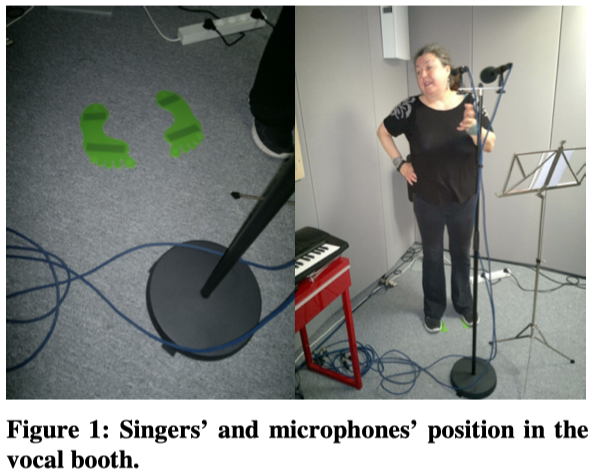
The recording of the singers took place in a vocal booth; reverberation time here was <0.15 seconds in the regarded frequency range. No fixtures were applied between singer and microphone. However, the position of the microphone stand and the singer was marked on the floor. The distance between singer and microphone was 30 cm. It is important to keep distance constant when investigating voice spectra [24], [25].
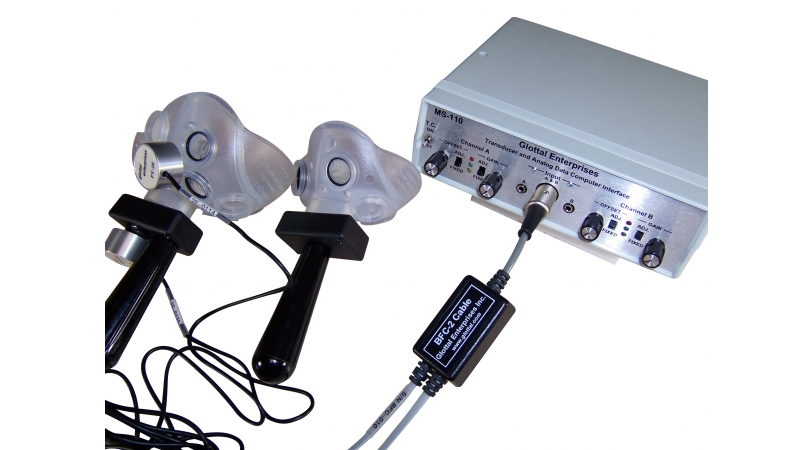
Two microphones were used for the recording: A pressure microphone (DPA4007) and a pressure gradient microphone (DPA4011). For these analyses only the signal from the pressure microphone was used. The recording system (Metric Halo) was set to 96 kHz/24 bit. The system (pressure microphone channel) was calibrated using a B&K acoustic calibrator.
2.3. Instruction of subjects
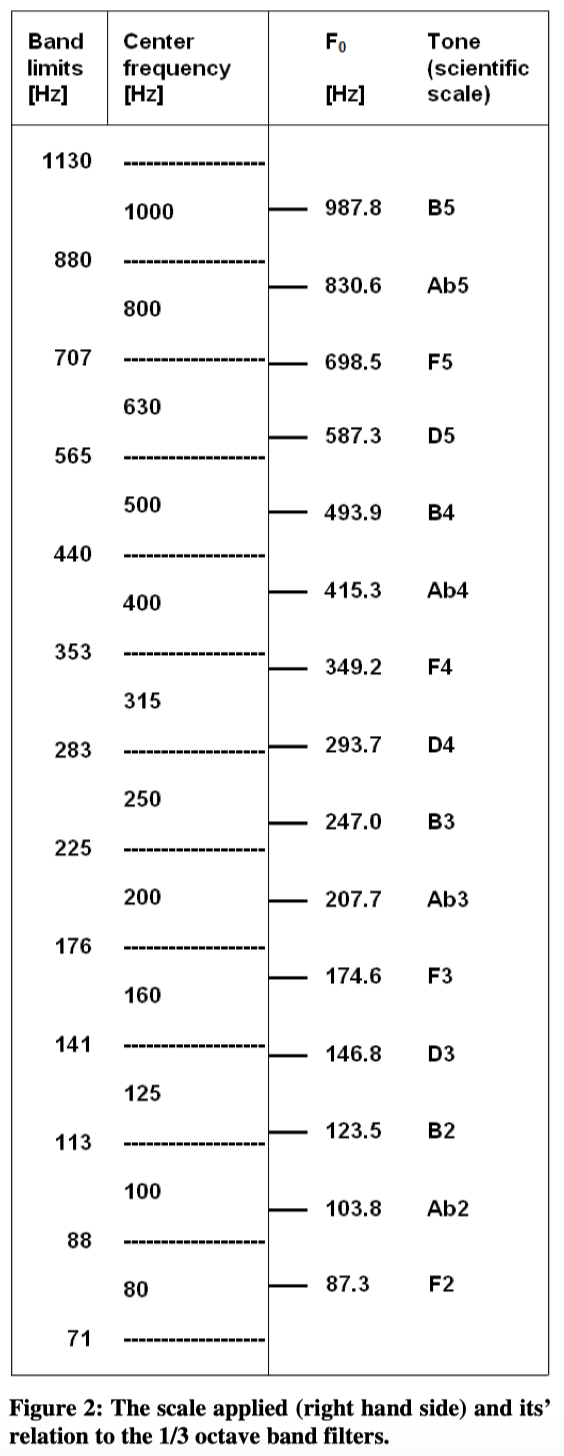
All subjects were instructed to sing a scale with a fixed interval of three semitones providing four tones per octave. The pitch range basically covered F2 (87.3 Hz) to B4 (987.8 Hz) to the extent it was within the ability of each singer. Each tone should have a sustained duration of at least 2 seconds.
Based on experience the following combination of vowels and modes was applied:
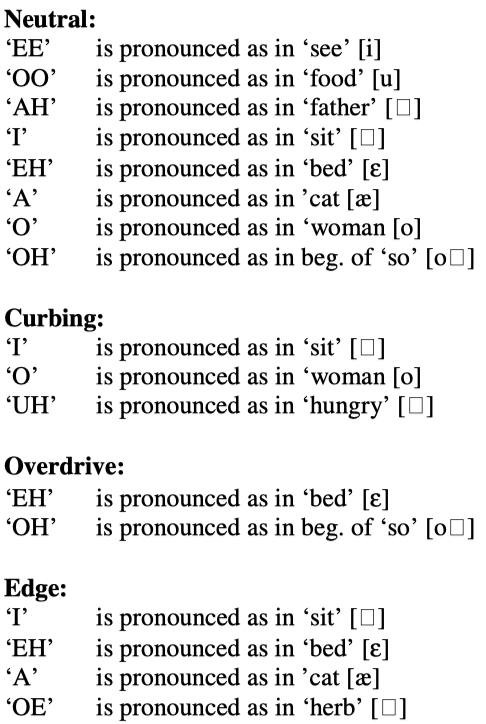
No instructions regarding produced SPL were given. This was determined by what singers felt comfortable and necessary in order to produce the given tone.
3. ANALYSES
3.1. Frequency analysis
The frequency analyses were carried out using a FFTbased software (Smaart Live).
Sampling Rate: 48 kHz
FFT size: 16 k
Window: Hanning
Frequency resolution: 2.9 Hz
Averages: 16
All spectra were recalculated to form 1/3 octave band values. As it can be seen in figure 2, the individual tones are not matching the center frequencies of the standard ISO 1/3 octave bands. Most of the analyzed tones had a sufficient duration. However, some tones were looped to provide a duration needed for the analysis.
3.2. Level analysis
The level was calculated from a summation of the measured frequency bands without any frequency weighting applied.
3.3. Formant analysis
Formant analyses were carried out using dedicated software: Praat, by Paul Boersma and David Weenink.
4. RESULTS
4.1. Singers’ SPL
As the singers did not receive any instructions regarding the acoustic level it was necessary to register the actual SPL performed. The analyses provide the acoustic level at the microphone, 30 cm from the singers’ mouth.
The curves in Figure 3 show the average un-weighted SPL of each of the four vocal modes for each of the singers. It can be seen that the level ranges from around 50 to 110 dB re 20 μPa.
The curves to some degree approximate a straight line. In Table 1 below the slope of the best fitted straight line is calculated together with the correlation expressed as R2 . In this table the slope is calculated as dB/interval of three 3 semitones.
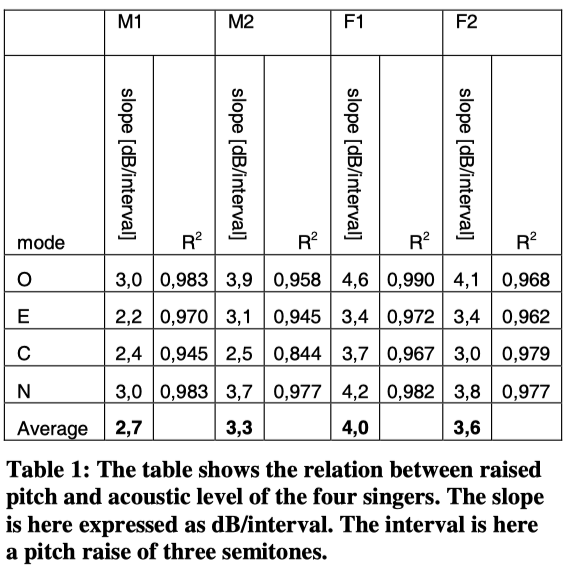
As the interval is 3 semitones the actual slope also can be expressed as 0.9-1.3 dB per semitone or 10.8-16 dB per octave (average: 3.4 dB per interval or 13.6 dB per octave).
This fact is of course known to many singers (subglottal pressure [26]) and affects their way of handling microphones when covering a large pitch range.
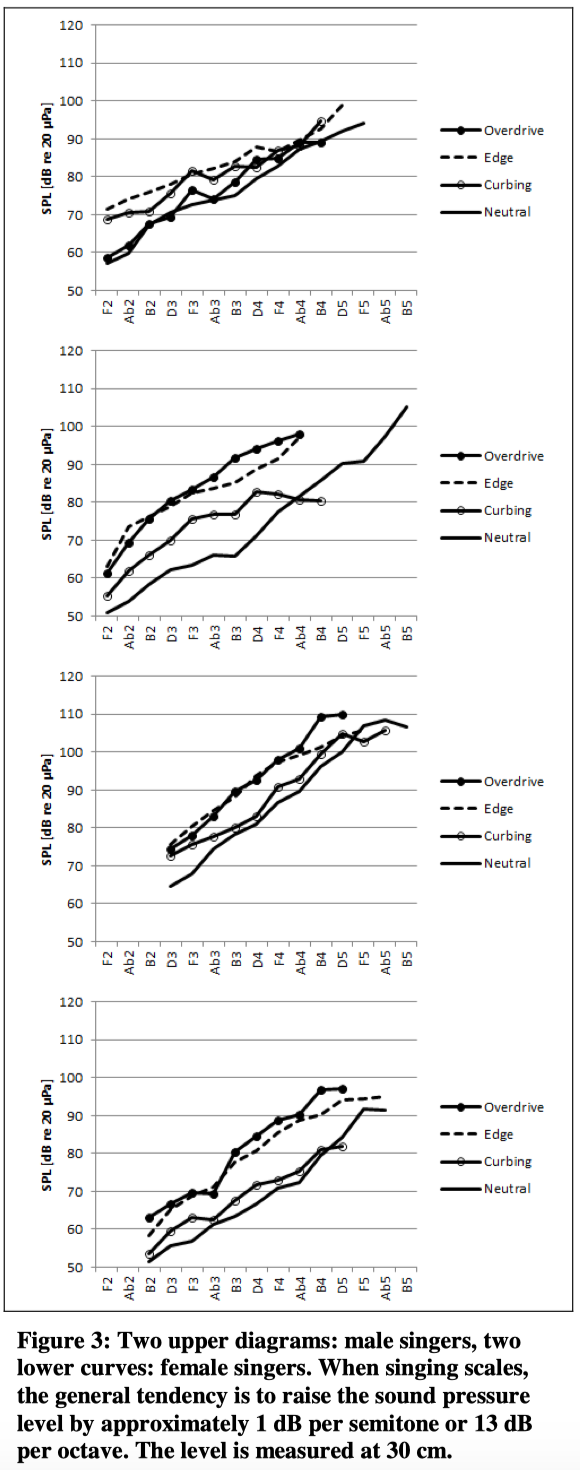
It can also be seen that the neutral mode in general is the softest of the four modes. Overdrive however in average is produced at a level 10 dB stronger.
4.2. Pitch vs. formants
By tuning the resonances of the vocal tract the sound of the voice cords is filtered and thereby forming what is perceived as different vowels. In particular the first and the second formants (F1 and F2) are responsible for the vowels formed and perceived. In phonetics the specific position of F1 and F2 is important.
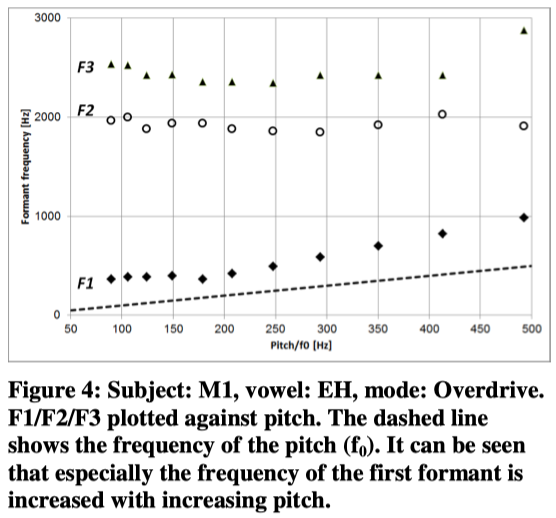
Compared to speaking, in singing the pitch is varying a lot (that’s the basic idea of singing). This may leave the singer with a problem of producing certain vowels, especially when the pitch exceeds the first formant(s). Further it is interesting to investigate how much the formant’s frequencies change with f0 .
In this study three vowels have been analyzed to find the F1/F2 values. Below is an example. The other subjects exhibit similar distribution of formants in dependence of pitch/f0 .
In phonetic science the Cardinal Diagram is a basic tool when vowels are defined. Here the F1 is plotted against F2. The frequency scales are inverted, because the diagram then largely defines the place of articulation /tongue position in the cavity of the mouth. Left hand side is the most frontal sound, closest to the lips.
In figure 5 all F1/F2 values for the vowels EE, OO and EH are plotted. (F1 is above f0 in all cases).
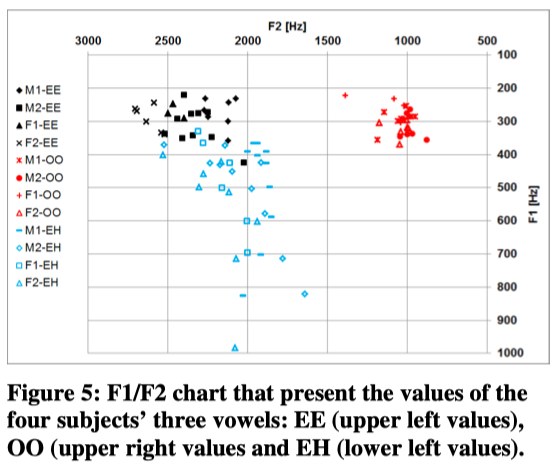
The vowel EE is located upper/front, OO is located upper/back and the EH is located mid (low mid)/front.
It must be noted that there is a minimum spread in the upper vowel values of which the OO exhibit the most stable position. Regarding the EH however, the values are widely spread in the frontal area. This can be related to the application of the vocal mode Overdrive whereas the EE/OO-vowels were sung in Neutral mode.
4.3. Spectral distribution, 1/3 octave
In [24] the detection of modes was determined by the evaluation of 1/3 octave spectra. The model for discrimination is shown in figure 6 below.
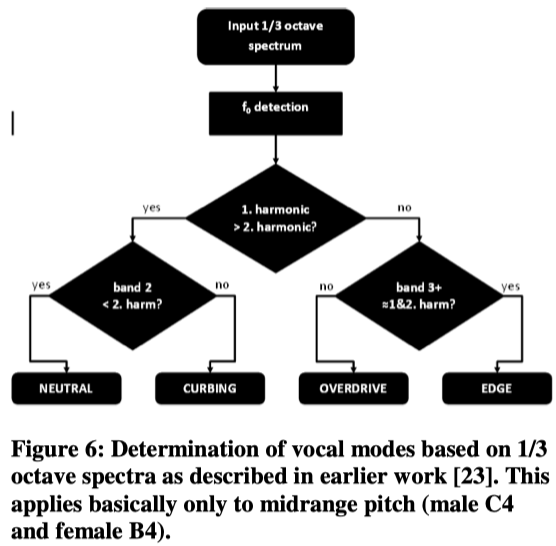
As the model indicates, the modes are defined by evaluation the 1st and 2nd harmonics and in addition two frequency bands (band 2: 2-4 kHz, and band 3: 8-10 kHz).
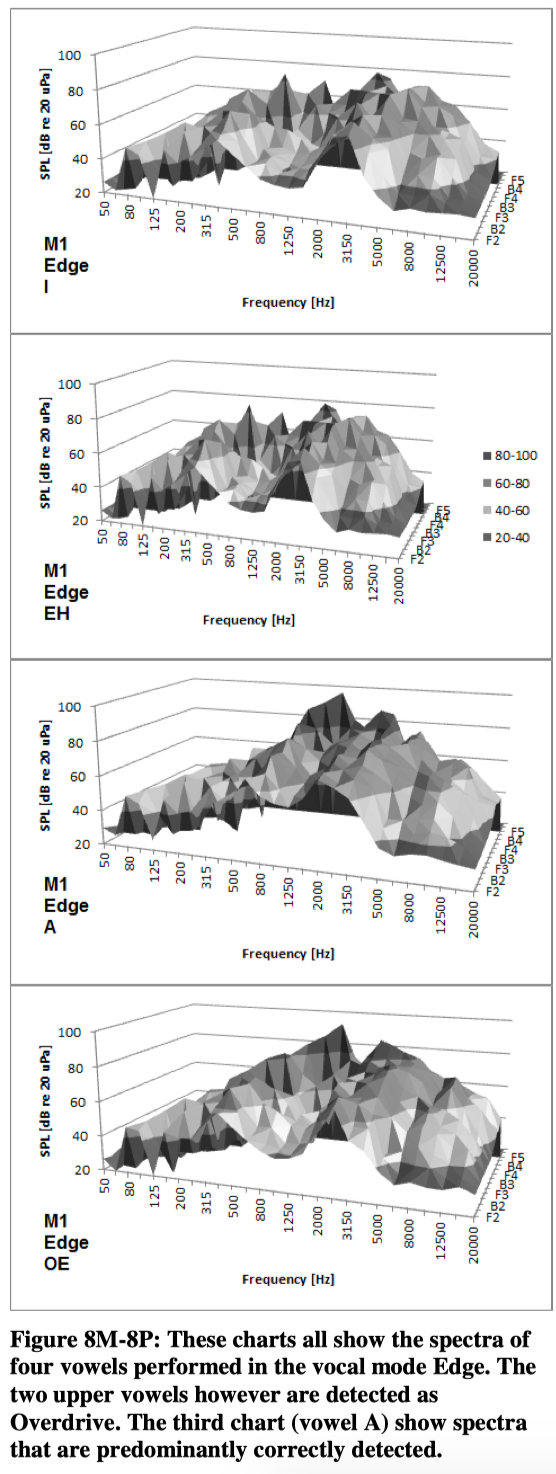
In this study the 1/3 octave analysis has been applied as well. Below in figure 7 is shown two series of spectra (subject M1, vocal mode: Overdrive, vowel: EH). The upper express the SPL measured. In the lower chart the absolute level is subtracted from each of the 1/3 octave values.
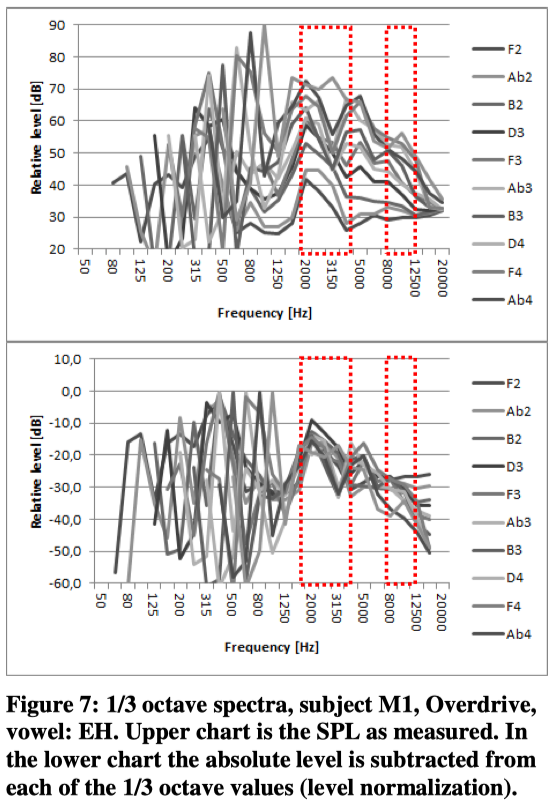
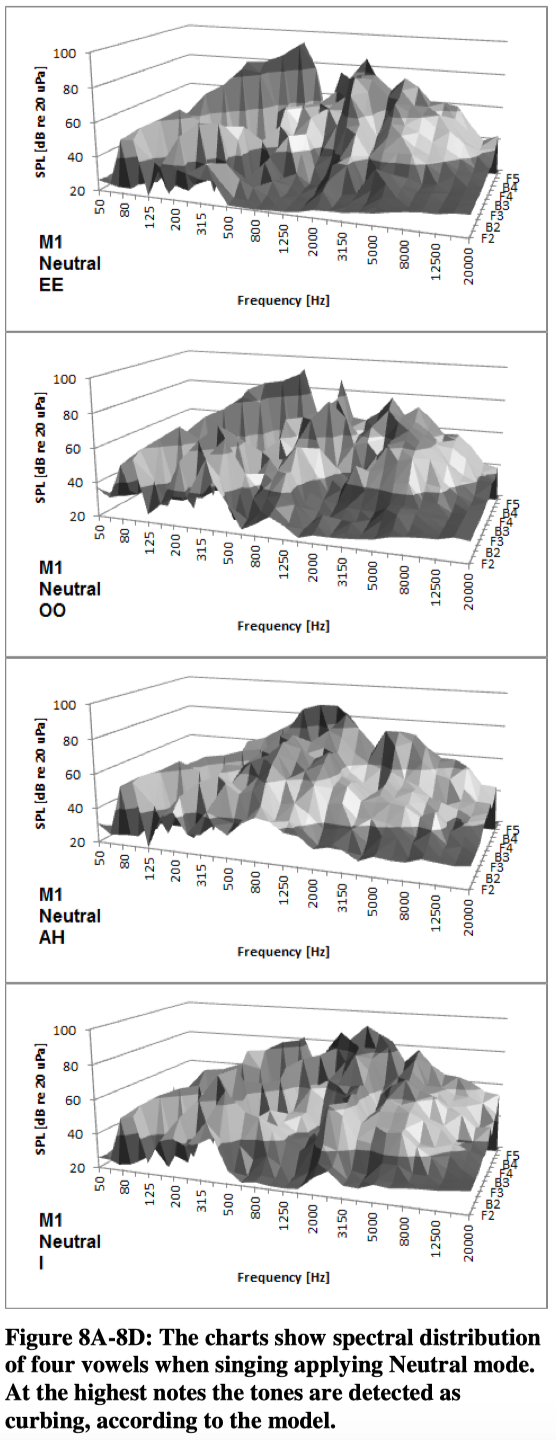
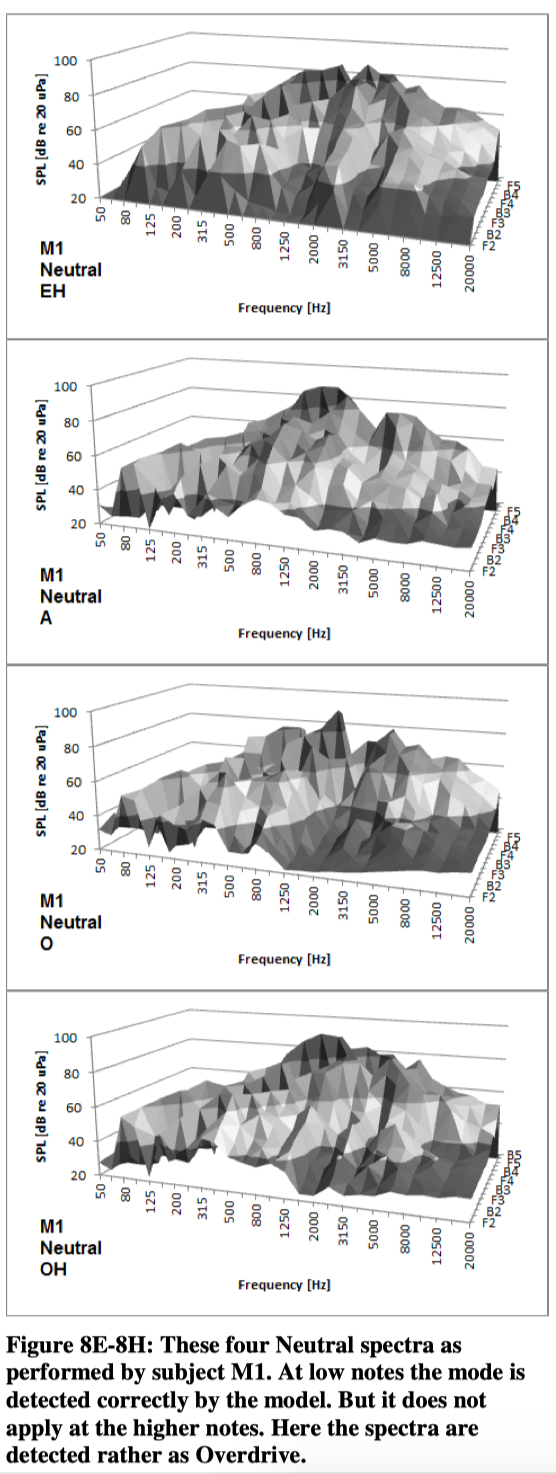
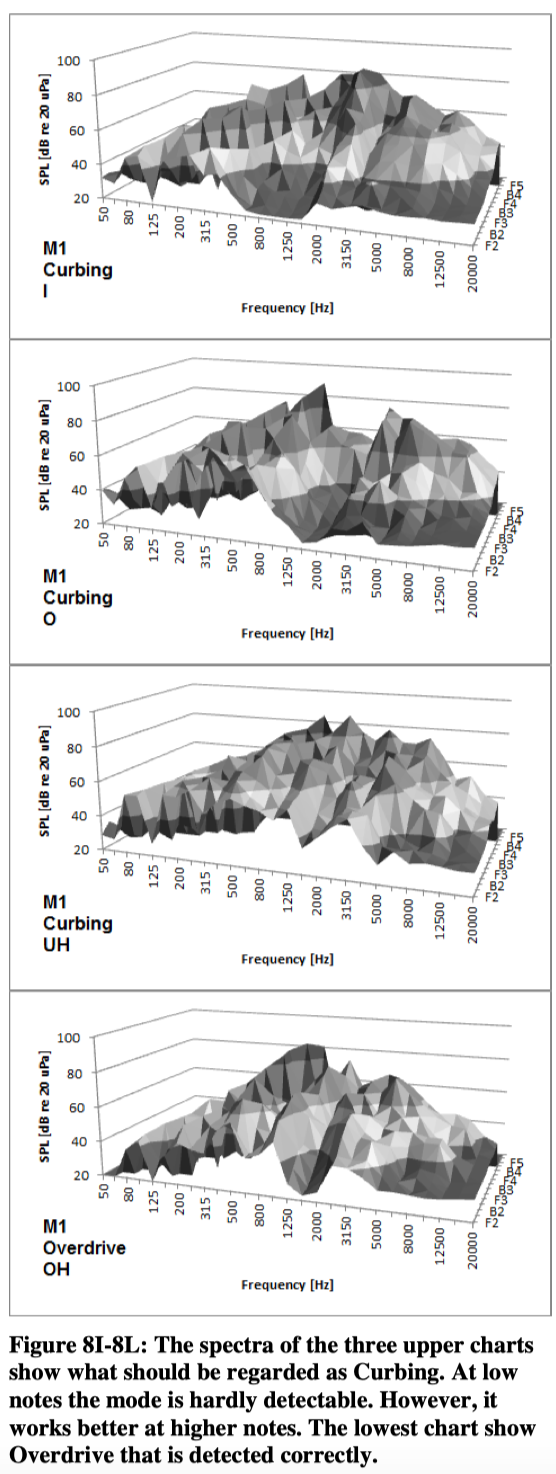
When these spectra in figure 7 are tested against the model they all are detected correctly except from the highest note. Most “Overdrive-spectra” actually are detected correctly. However, it seems like the model does not fit with the same consistency in the other modes. The following figures show the spectral distribution for M1. Although the graphics are not ideal, the surface charts can provide some kind of impression of the characteristics of each combination of tone, vocal mode and vowel.
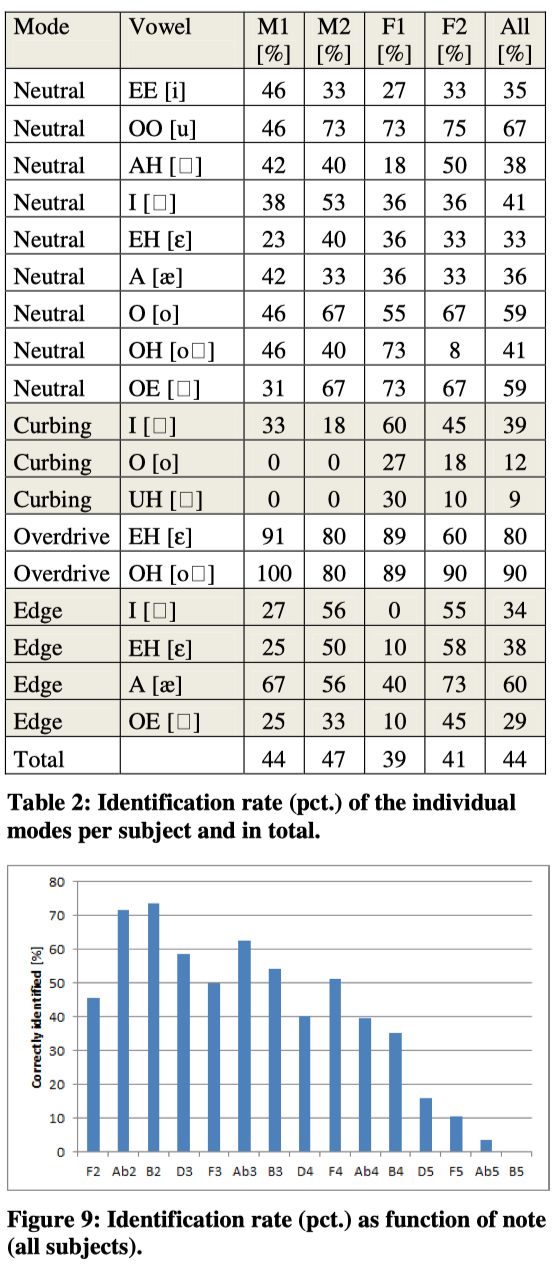
4.4. Identification rate
Running all spectra through the model provides the following results:
5. DISCUSSION
Based on the results presented it is obvious that the model is far from perfect. It can be seen that in general it fails with increase of pitch. There are several reasons for that. One reason is the fact that the level of the second harmonic at higher pitch is affected by the formants of certain vowels. Corrections may be introduced in the model.
Looking at the spectra and listening to the voice samples leaves the impression that it is not certain whether this is solely caused by the model being too primitive or the reason in some cases might be the singers not performing the modes/vowels perfectly despite the intention to do so. In that case the model works as intended.
In extension of this work is needed a test that combines the model with an extensive listening test to revalidate each voice sound sample.
6. CONCLUSION
This paper reports the outcome of a study on characterization of vocal modes. Four singers performed full range scale-singing.
The recorded signals have been analyzed and tested against a model formerly established. It showed that the model in general detected overdrive very well. However, detection of other modes did not exhibit the same overall consistency especially at high pitch.
Some bonus information has come out of the project.
1: When singing scales, the singers’ sound level is increased by approximately 13 dB per octave (raising pitch) as a result of the related sub-glottal pressure.
2: The formants are relocated in dependence of pitch, especially 1 st format when generated front / low mid.
7. ACKNOWLEDGEMENTS
The authors want to thank all the singers and teachers of the CVI for their efforts.
8. REFERENCES
[1] Sadolin, Cathrine: Complete Vocal Technique, 3rd edition, Copenhagen 2012, ISBN 978-87-992436-7-9 (English version, also available in Danish, Dutch, Finnish, French, German and Swedish).
[2] McGlashan, Julian: Extreme vocal effects: http:// www.youtube.com/watch?v=nJu_BQrfk3E. Dr. Julian McGlashan from Queens Medical Center in Nottingham presenting a part of a research study made in cooperation with Cathrine Sadolin and Henrik Kjelin from Complete Vocal Institute in Copenhagen.
[3] Bartholomew, Wilmer T.: A physical definition of 'good voice-quality' in the male voice. J. Acoust. Soc. Am. 1934;6:25–33.
[4] Sundberg Johan: Vocal tract resonance. In: Staloff RT, editor. Professional Voice: The Science and Art of Clinical Care. 2nd ed. San Diego: Singular Publishing Group, Inc.; 1997. pp. 167–184.
[5] Sundberg Johan: Articulatory interpretation of the "singing formant". J. Acoust. Soc. Am. 1974 Apr; 55 (4):838–844.
[6] Sundberg Johan: What's so special about singers? J. Voice. 1990 Jun; 4(2):107–119.
[7] Sundberg Johan: Level and center frequency of the singer's formant. J. Voice. 2001 Jun; 15(2):176–186.
[8] Sundberg J., Lindblom B., Liljencrants J.: Formant frequency estimates for abruptly changing area functions: a comparison between calculations and measurements. J. Acoust. Soc. Am. 1992 Jun; 91(6):3478-82.
[9] Bloothooft, G.; Plomp, R.: The sound level of the songer’s formant in professional singing. J. Acoust. Soc. Am. 1986, vol. 79: 2028-2033
[10] Oliveira Barrichelo V.M.; Heuer R.J.; Dean CM, Sataloff, R.T.: Comparison of singer's formant, speaker's ring, and LTA spectrum among classical singers and untrained normal speakers. J. Voice. 2001, Sep; 15 (3):344–350.
[11] Stone R. E.; Jr.; Cleveland T.F.; Sundberg J.: Formant frequencies in country singers' speech and singing. J. Voice, 1999 Jun; 13(2):161–167.
[12] Cleveland T. F.; Sundberg J.; Stone R. E.: Longterm-average spectrum characteristics of country singers during speaking and singing. J. Voice. 2001, Mar; 15(1):54–60.
[13] Boersma, Paul; Kovacic, Gordana: Spectral characteristics of three styles of Croatian folk singing. J. Acoust. Soc. Am. 119(3), Mar. 2006: 1805-1816
[14] Lundy, D.S.; Roy, S.; Casiano, R.R.; Xue, J.W.; Evans, J..: Acoustic analysis of the singing and speaking voice in singing .students.J. Voice.2000 Dec;14(4):490–493
[15] Titze, I.R.; Jin S.M.: Is there evidence of a second singer's formant? J. Singing. 2003; 59(4):329–331.
[16] Nawka T.; Anders, L.C.; Cebulla, M.; Zurakowski, D.: The speaker's formant in male voices. J. Voice. 1997 Dec; 11 (4):422–428.
[17] Howard, D.M.; Brereton, J.; Welch, G.F.; Himonides, E.; DeCosta, M.; Williams, J., and Howard, A.W.: Are Real-Time Displays of Benefit in the Singing Studio? An Exploratory Study, J. Voice, 21(1):20-34, 0892-1997, January, 2007
[18] Winckel, Fritz: A quick test method for the diagnosis of speaker’s and singer’s voices under stress. AES 53rd Convention, preprint A-4 (1976).
[19] Zwan, Pawel: Expert system for automatic classification and quality assessment of singing voices. AES 121st Convention, preprint 6898 (2006).
[20] Zwan, Pawel; Kostek, Bozena: System for automatic singing voice recognition. J. Audio Eng. Soc. Vol 56, No. 9 (2008).
[21] Presentation of singing voice classification system, http://www.multimed.org/singing
[22] Mayor, Oscar; Bondana, Jordi; Loscos, Alex: Performance analysis and scoring of the singers voice. Proceedings of the AES 35th International Conference, London, UK, 2009.
[23] Brixen, Eddy B.; Sadolin, Cathrine, and Kjelin, Henrik: On acoustic detection of vocal modes. AES 132nd Convention, preprint 8620 (2012).
[24] Brixen, Eddy B.: Spectral degradation of speech captured by miniature microphones mounted on persons’ head and chest. AES 100th Convention, preprint 4284 (1996).
[25] Brixen, Eddy B.: Near field registration of the human voice: Spectral changes due to positions. AES 104th Convention, preprint 4728 (1998).
[26] Sundberg, Johan: My research on the singing voice from a rear-view-mirror perspective. Voice Research Centre, Department of Speech Music Hearing, KTH, Stockholm. (Invited presentation).