2698 阅读 2020-02-10 15:13:37 上传
ASPECTS OF VOICE QUALITY: DISPLAY, MEASUREMENT AND THERAPY1
Eva Carlson2 and David Miller3
One approach to outcome measures for speech and language therapy is to display measures of the physical, acoustic, correlates of the perceptually salient features of the structure of speech. A difficulty with this approach is that there is no simple mapping of physical correlates onto speech percepts. In this workshop the physical measures of voice fundamental frequency and larynx contact quotient are explored in relation to the perception, analysis and treatment of aspects of voice quality in a speech and language therapy clinic. A fundamental principle is to analyse samples of continuous speech. The workshop will focus on clients with unilateral vocal fold paralysis.
Introduction
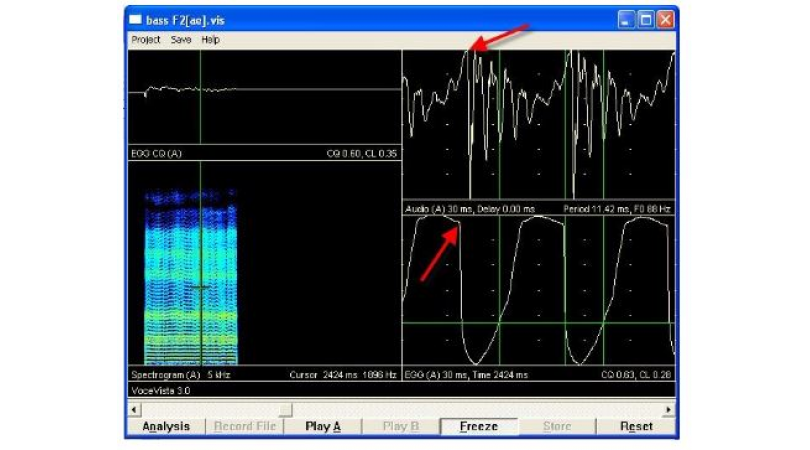
The laryngograph (Fourcin, 1981,1982) allows a therapist to illustrate vocal fold contact patterns using the Lx waveform (see Figure 1) to clients during running conversation or reading aloud and while practising voice exercises.

The rapid rise in the Lx waveform to a maximum on vocal fold approximation, the ‘closing phase’, the more gradual ‘opening phase’ and the relationship in duration of the ‘closed’ and ‘open’ stages of the vocal fold vibratory cycle, makes Lx a simple and easily explained concept to describe to lay persons learning to modify their vocal habits. It has proved particularly useful for visual feedback purposes and for evidence of improvement in vocal fold function after surgical intervention in cases of organic lesions of the vocal folds (Carlson 1993, 1995b) and in treatment of puberphonia in adults (Carlson 1995a), where the change in vocal fold contact patterns from falsetto mode to modal phonation is clearly seen in the changed relationship between the closed and open phases of the vibratory cycle (see figures 2a and 2b).

Unilateral vocal fold paralysis: a case study
Measures, based on the voice source signal Lx, may be made on several minutes of continuous speech to illustrate the physical and perceptual quality of a person’s voice. These measures can be linked to a range of real time displays to illustrate dynamic changes in vocal fold contact patterns with therapeutic and/or surgical intervention.
The following illustrates the voice of a woman, aged 70 years with a left vocal fold palsy.
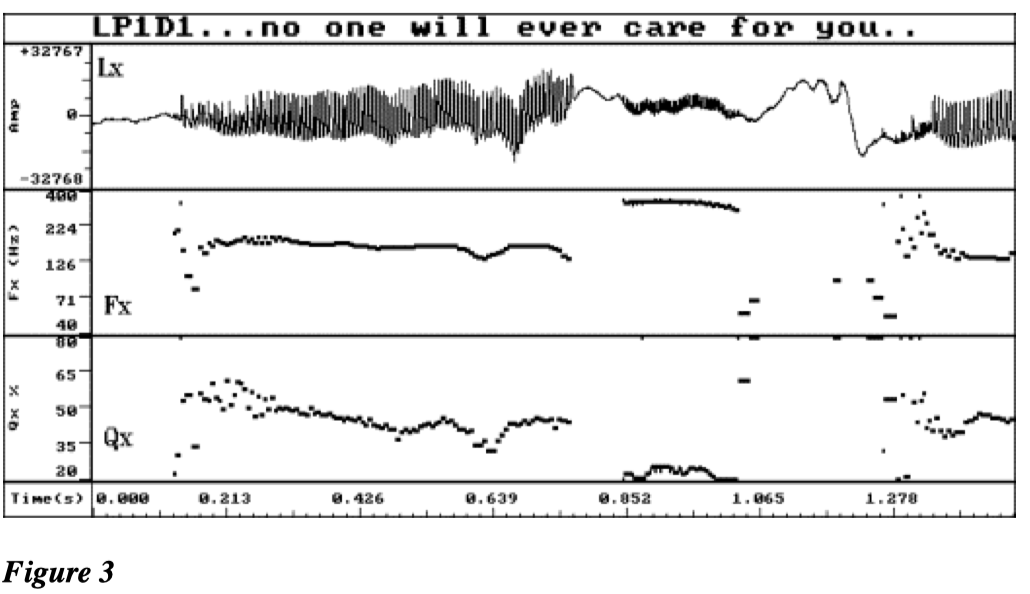
Figure 3 shows the Laryngograph waveform (Lx) with the derived fundamental frequency (Fx) contour and the larynx contact quotient (Qx) contour. In the phrase ‘… no-one will ever care for you’, evidence of voice irregularity is shown at the start of the first section of continuous voicing ‘no-one will ever’. In the attempt to stress the word ‘care’ the subject is unable to adequately control an attempted high fall and goes into a falsetto type of phonation for ‘care’ and back to a modal vibration ‘for you’ which once again starts with irregularity before stabilising. This uncontrolled switching between a modal pitch and falsetto on stressed words or phrases, coupled with irregularity at the start of each section of modal voicing is perceptually striking in this case of unilateral paralysis. Physically this represents her difficulty in maintaining regular modal vibration over a normal speaking range with a paralysed vocal fold.

Figure 4 is a plot of the distribution of fundamental frequency for the two minute sample of read text, from which the phase ‘no-one will ever care for you’ was taken. The features discussed in relation to the fundamental frequency trace can also be seen here. The main peak in the distribution with a mode at 151 Hz represents the region of modal voice. The smaller high frequency peak with a mode at just over 300Hz represents the falsetto region and the smaller peak on the left of the main mode represents the irregularity found throughout the modal voicing but typically at voice onsets. These perceptually and physically important characteristics would be missed by measures which only look at a few seconds of continuous voicing.
In Figure 5, the second order distribution in which cycle by cycle irregularity has been discarded shows more clearly that the low frequency peak in the first order distribution was irregular (it disappears in the second order distribution). It shows also that the modal range is comparatively restricted, with a frequency area before the falsetto register in which regular phonation cannot be sustained.

Figure 6 shows a detail of the Lx waveform (a), Fx contour (b), and Qx contour (c), taken from the regular portion of the first section of voicing and Fig 7 shows a similar section from the high pitched ‘care’. Whilst both these sections are regular as clearly shown in the fundamental frequency trace, the phonations have a very different quality which is demonstrated in the Qx trace. The modal phonation in Figure 6c has a higher Qx (50%) compared to the falsetto phonation in Figure 7c (20%). The falsetto phonation would be perceived as more breathy.
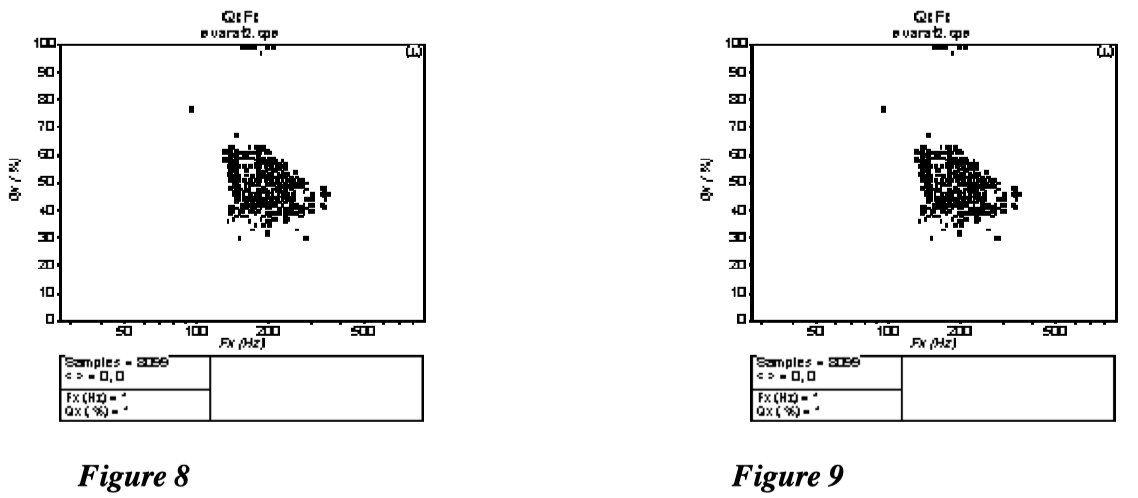
Figure 8 is a plot of % contact quotient against fundamental frequency. This clearly shows the modal and falsetto modes as distinct frequency clusters with the falsetto mode clustering between 20% and 40% contact quotient, and the modal voice between 30% and 55%. In this case the Qx/Fx clusters are more diffuse than is the case with the normal speaker shown in Figure 9. This is typical of the less structured and controlled use of Qx variation possible with unilateral paralysis.
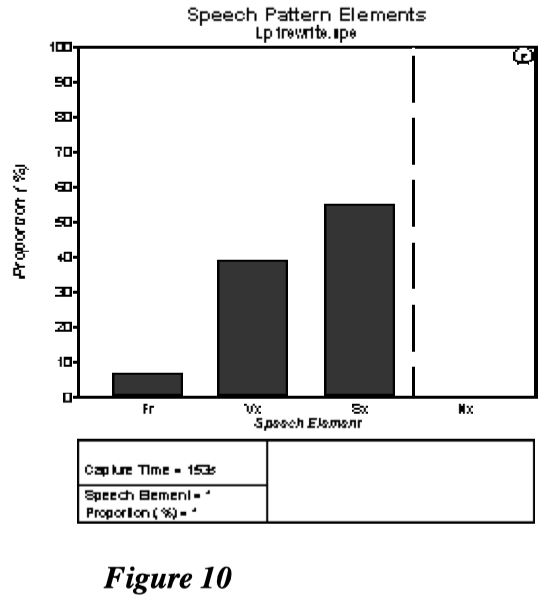
The Speech Pattern Elements in Figure 10. shows the proportion of time spent during running speech on voiceless excitation such as fricatives and plosive bursts (Fr), the proportion of time on voicing (Vx) and in silence (Sx). The fourth column can be used to display the proportion of time spent nasalising (Nx). This type of analysis can give a useful overview of an individual’s phonatory characteristics. In this case the time spent in silence is rather high and reflects the need of the patient with vocal fold palsy to constantly replenish her breath, which quickly runs out due to delayed contact and poorly sustained vocal fold adduction.
References
Carlson, E.I. (1993). Accent method plus direct visual feedback of electroglottographic signals. In: Voice Therapy, Clinical Studies. Ed. Joseph C. Stemple. Pub. Mosby Year Book Inc., St. Louis.
Carlson, E.I. (1995) a) Electrolaryngography in the assessment and treatment of incomplete mutation (puberphonia) in adults. European Journal of Disorders of Communication, 30, 140149.
Carlson, E.I. (1995) b) A study of voice quality in a group of irradiated laryngeal cancer patients, tumour stages T1 and T2. Unpublished Ph.D. thesis. (London University).
Fourcin, A.J. (1981). Laryngographic assessment of phonatory function. In: C.L. Ludlow and M.O. Hart (Eds) Proceedings of the Conference of the Assessment of Vocal Pathology, Maryland.
Fourcin, A.J. (1982). Electrolaryngographic assessment of vocal fold function. Journal of Phonetics 14, 435-442.
1This paper originally appeared in the International Journal of Language and Communication Disorders, 1998. Volume 33, Supplement p304-309.
2Speech and Language Therapy Department, St. Thomas’s Hospital, London SE1 7EH.
3Laryngograph Ltd, 1 Foundry Mews, London NW1 2PE.


