1502 阅读 2020-02-11 10:07:14 上传
Laryngograph as a tool in diagnosis and therapy of voice disorders
JOLANTA ZIELIŃSKA EWA BRZDĘK
Department of Special Pedagogy Department of Special Pedagogy
Pedagogical University of Cracow Pedagogical University of Cracow
Ingardena 4 Ingardena
30-060 Kraków, Poland 30-060 Kraków, Poland
jzielin@op.pl ebrzdek@wp.pl
Abstract: The electroglottography method is an instrumental analysis by the device called Laryngograph, which can be practically applied in the speech signal analysis for people with voice disorders issues. In this paper capabilities of this device are estimated. A very interesting fact is that visualization of the speech signal obtained with the use of Laryngograph device allows to detect the acoustically and phonetically most important features and present them in a graphical form. The research show that Laryngograph can a very efficient tool in such domains as: speech therapy (in order to improve speech process); clinical examination of nose and throat (to diagnose work of vocal folds, e.g., after surgical procedures); improvement of the voice of singers and announcers; examination of relations between speech and work of vocal cords; teaching foreign languages.
The experimental research presented in this paper concerns also the evaluation and the development of oral ability of deaf children. The obtained results and following practical conclusions can serve as guidelines in clinical and logopedical applications in voice rehabilitation and communication development of groups of children with hearing impairments.
Key-Words: - electroglottography method, Laryngograph, speech signal analysis, voice disorders, voice profile, vocal cords irregularity
1 Introduction
The voice is one of the most important means of human communication and any disorder of it makes the communication less efficient. Voice disorders can be: organic, functional, or a combination of the two.
Organic voice disorders structural and neurogenic.fall into two groups:
Structural disorders mean that something is wrong with the physical mechanism (this often involves tissue or fluids of the vocal folds), which causes some lesion (physical abnormality) of the larynx. In this group we can distinguish the following disorders:
Contact Ulcers, Cysts, Granuloma, Hemorrhage, Hyperkeratosis, Laryngitis, Leukoplakia, Nodules (nodes), Papilloma, Polyps, Trauma, Miscellaneous growths [6, 8].
Neurogenic disorders are caused by problems in the nervous system as it interacts with the larynx.
For example, we can observe the damage of the recurrent laryngeal nerve (which controls the movement of larynx) during cardiac, pulmonary, spinal and thyroid surgeries. When the nerve is damaged, it causes a paresis (weakness) or paralysis (complete lack of movement) in the vocal fold of the affected side. Other neurogenic voice disorders are related to other kinds of problems in the central nervous system. In this group we can distinguish the following disorders:
Paralysis/Paresis, Spasmodic Dysphonia (Laryngeal Dystonia), Tremor (Benign Essential Tremor), and voice problems caused by another neurological disorder (e.g. Parkinson's Disease, Myasthenia Gravis, ALS/Lou Gherig's Disease).
A functional disorder means that the physical structure is normal, but the vocal mechanism is being used improperly or inefficiently, which is caused by poor muscle functioning. So, all functional disorders fall under the category of muscle tension dysphonia and correspond to various patterns of muscle tension. In this group we can distinguish the following disorders:
Muscle Tension Dysphonia (general), Anteriorposterior Constriction, Hyperabduction, Hyperadduction, Pharyngeal Constriction, Ventricular Phonation, Vocal Fold Bowing.
A final category of functional voice disorder is the psychogenic disorder, in which a poor voice quality becomes a symbolic, or outward, manifestation of some unresolved psychological conflict.
Psychogenic disorders exist because it is possible for the voice to be disturbed for psychological reasons. In this case, there is no structural reason for the voice disorder, and there may or may not be some pattern of muscle tension behind it. While it is quite common for a psychogenic component to exist in a voice disorder, voice disorders that are caused by a psychological disorder are relatively rare.
In general, there aredifficulties with categorizing the voice disorders , because quite often different types of disorders interact.
The problems connected with voice emission concern dynamic breathing, work of vocal cords, phonation, nasality, articulation and prosodic features (accent, rhythm) of voice. They can be a cause or consequence of wrong emission and can be interrelated with different symptoms of organic and functional voice disorders [2, 5, 11]. One of important reason for this is deafness, even partial.
The main traditional methods of diagnosis of voice disorder are: laryngostroboscopy, fibroscopy, tomography of larynx. Electromyography, glottography and laryngofotokymography have limited meaning in estimation of voice instruments [4, 10]. The electroglottography method is quite new and not so commonly applied; it is based on the acoustic analysis of voice samples, which allows the objective estimation of phonatory function of larynx.
2 General characteristic of the electroglottography method
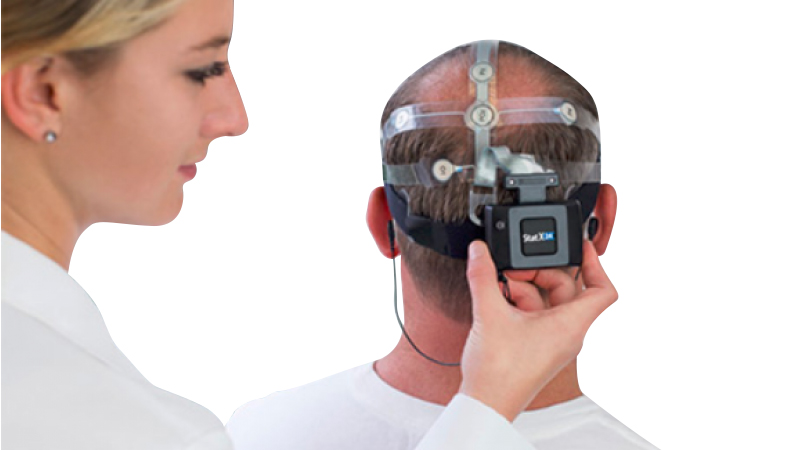
The electroglottography method is based on the electrical impedance measurement between vocal folds during their vibrations in speaking process, which is a function of the changes in mutual position of the folds while larynx vibrates. When vocal folds are cramped the value of this function is smaller, than in the case when they are opened. The tool with which those measurements are performed, in noninvasive ways, is electroglottograph (shortly, EGG), sometimes referred to as a laryngograph.
This electrical impedance vary slightly with the area of contact between the moist vocal folds during that part of the glottal vibratory cycle in which the folds are in contact. However, because the percentage variation in the neck impedance caused by vocal fold contact can be extremely small and varies considerably between subjects, no absolute measure of contact area is obtained, only the pattern of variation for a given subject.
Early thorough investigations of commercially available laryngograph units has been made by Baken. However, using modern low noise electronics, EGG noise levels can be brought down enough so that the noise is approximately 40dB (a factor of 100) less than a typical EGG signal from an adult voice.
In addition, by the use of multiple channels simultaneously, the technique can be made easier to use and more reliable by giving the user an indication of the correct positioning of the electrodes, and providing a quantitative measure of vertical movements of the larynx during voice production.
Electroglottograph signals have found use in stroboscope synchronization, voice fundamental frequency tracking, tracking vocal fold abductory movements and the study of the singing voice.
Electroglottographic wavegrams are a new technique for displaying and analyzing EGG signals. The technique provides an intuitive means for quickly assessing vocal fold contact phenomena and their variation over time [4, 7, 9, 10].
3 Practical usage of the laryngograph
The experimental research was made in Cracow (Poland) by J. Zielińska [10]. This investigation concerned the assessment and evaluation of changes in the level of oral development of children with hearing impairments. The research have been conducted with the use of two computer attachments: Laryngograph Processor PCLX and Nasality, connected to a PC computer. The obtained results and following practical conclusions can serve as guidelines in clinical and logopedical applications in voice rehabilitation and communication development of groups of children with hearing impairments (whose native language is not necessarily Polish).
This kind of computer research is the first and unique. It fully considers the specific character of the Polish language, including very difficult dental phones, digraphs and prosodic features of speech, mainly the flow of the melodic waveform, which largely influences the understanding of speech in Slavonic languages. Hence, the research results can be applied to not only diagnosis and rehabilitation of children with oral problems, for whom the verbal language is often not a natural language, i.e. those children who cannot hear, but also for those, who have cleft palates or other defects. They can also help teach Polish to foreign students.
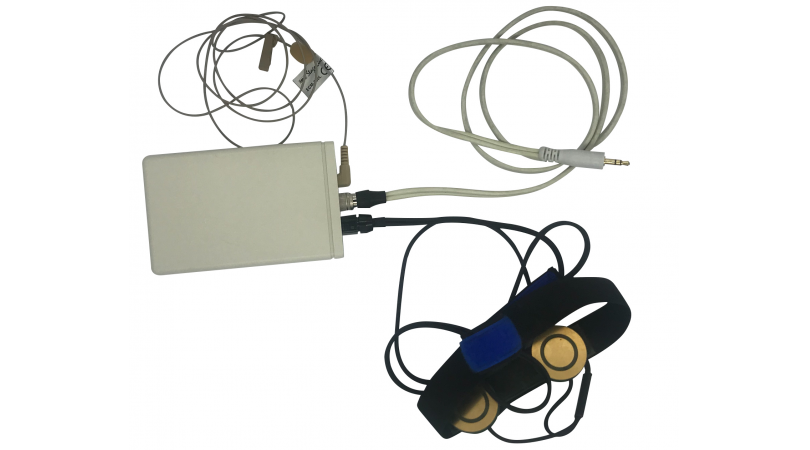
The most important element of the speech signal analysis is the way the signal is sampled and remembered by computer. Computer attachment Laryngograph Processor PCLX possesses three input signal detectors.
The initial signal of the laryngograph Lx (Lx waveform in figure 1) reflects the work of vocal folds and is the base for determination of basic frequency Fx. Analysis of the signal cycle Lx helps to separate its three phases (closing, connecting, opening of vocal folds). It gives information about any abnormality of vocal route work, especially the work of vocal folds.
The second decoder (microphone) should be placed about 2.5 cm from the patient’s mouth (line Sp in figure 1). Sp signal, which is obtained form the microphone inlet enables a dynamic visualization of signal timing, evaluation of its volume, loudness and exercising dentalised phones. The analysis of Fx signal gives information about all parts of a proper signal, which are: proper dynamic breathing, economical breathing, work of vocal chords, proper articulation, prosodic features, such as: speed, rhythm, accent or melody, i.e. these elements, which decide about signal expression and, additionally, show the level of phone voicing (no voicing – no picture).
The third electrode placed on nostrils is its inlet. The waveform generated by this electrode on computer screen shows the dynamics of the air flow through the nose of the examined person, by measuring nostrils vibrations, like an accelerator which measures changes of speed in time, i.e. the acceleration of nostrils movement (line NxACC in figure 1). Precise maximum amplitude values can be specified by creating a two-dimensional amplitudefrequency spectrum. PCLX software of the Laryngograph chart has these possibilities. Maximum values, visible on computer screen are called formants. Their frequency and amplitude characterize a phone and are closely related to articulator configureuration that has appeared during its creation. Figure 1 is a deliberately transformed picture for the full analysis of oral efficiency. NxACC signal enables to determine proper nasal phones production, including the work of glottis.
Such analysis of voice parameters enables to draw many practical diagnostic-therapeutic conclusions.
Figure 1 presents the main screen of integrated system for voice examination Speech Studio, which have all the possibilities of speech signal analysis that were described previously. There are two toolbars available (top and side one), which allows to perform several operations, starting with signal activation, its remembering, recovering, analysis, and configuring the amount and type of visible flows and scales.

Fig. 1 Integrated system for voice examination Speech Studio [10]
The fundamental part of the screen is seven flows, which characterize the speech signal. The two most important flows present changes of amplitude in time and the work of vocal folds. In the bottom part of the screen there are two windows. In the first one average amplitude-frequency spectrum are displayed. In the second one there are values, which characterize the speech profile of the patient. In this profile there are defined following parameters: minimum, maximum, average value, standard deviation for the basic Fx frequency and occlusion factor Qx (WZG) and also other parameters describing disturbances of the frequency (Jitter) and amplitude (Shimmer). The flow of the occlusion factor Qx depends directly on the Lx flow and is presented as a percentage value. It determinates the percentage of time, when vocal folds are opened,that is the time of occlusion and opening during statement pronunciation [1, 3, 7].
4 Computer Analysis Of Research Material
At present in Pedagogical University of Cracow we are investigating the general profile of speech patterns and the vocal cords work irregularity. The research is conducted in the group of patients with dysphonic problems, organic and functional voice disorders. The scientific project is realized in cooperation with the University Hospital of Collegium Medicum of Jagiellonian University and Sanatorium of Salt Mine “Wieliczka”.
There are various possibilities of research material analysis starting with statistical calculations, parametrical calculations, till graphical processing. In order to obtain more precise signal view we can select any part of it and freely enlarge, so that even the smallest pathological change can be detected. This software enables also measurements of time intervals between individual points of the signal. It can be performed by appropriate placing two cursors on the screen and time interval between them will be measure.
Quantitative analysis (QA) provides a range of connected speech and voice analyses that is only available from Laryngograph. It has proved to be important both clinically and in voice study. It introduces concepts that are new to many users. So, predefined groups of examples have been set up to guide users through QA, from simple pitch measurements to complex multi component analysis. They are numbered and the ordering is designed to provide a basis for structured training and goes from simple to more complex [1]:
1. Frequency Fx — pitch range & regularity.
2. Amplitude Ax — loudness range & regularity.
3. Contact Qx — % range & regularity.
4. Loudness + contact + frequency.
5. Pitch & Contact.
6. Frequency Fx & contact Qx — pitch & quality.
7. Aspects of Voice Quality.
8. Frequency Related Measurements.
9. Elapsed Time Measurements.
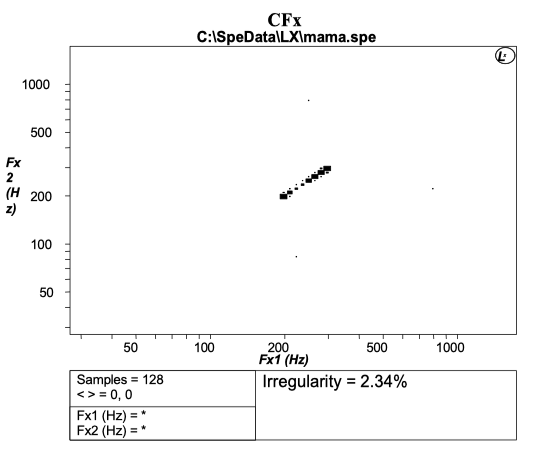
The Fx signal analyses is based on determinations of 23 histograms, including CFx histogram, which presents the vocal cords work irregularity (figure 2).

Fig. 2 Sample CFx histogram, which presents the vocal cords work irregularity [10]
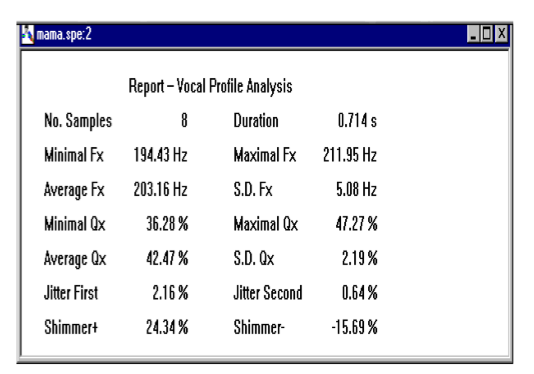
Computer analysis of speech signal allows obtaining the voice profile of the patient in the form of acoustic parameters (figure 3).

Fig. 3 Sample voice profile for ‘mama’ statement, Speech Studio program [10]
The voice profile contains the average value of basic Fx frequency, its minimum and maximum value. It makes also possible to determinate frequency oscillations, standard deviation, the factor of frequency disturbance called Jitter, percentage value of the average occlusion factor Qx, its minimum and maximum value and standard deviation. Additionally, as the last information , the value of voice amplitude disturbance factor (called Shimmer) is presented.
References:
[1] E. Abberton, D. Howard, A. Fourcin, Laryngograph assessment of normal voice: a tutorial, Clinical Linguistic and Phonetics 3, Informa Healthcare 1996, pp. 243-259.
[2] E. Abberton, Voice quality of deaf speakers, (in:) Kent, R. D., Ball, M. J. (eds.) Voice quality measurement, Singular Publishing 2000, pp. 449460.
[3] E. Abberton, E. Carlson, A window on the voice - how I use computers in therapy, Speech and Language Therapy in Practice, 1999, pp. 226-227.
[4] RJ. Baken, Clinical measurement of speech and voice, Boston: College Hill Press, 1987.
[5] A. Fourcin, E. Abberton, Hearing and phonetic criteria in voice measurement: Clinical applications, Logopedics Phoniatrics Vocology 33(1/2008), pp. 35-48.
[6] I. Guimaraes, E. Abberton, Health and voice quality in smokers: an exploratory investigation, Logopedics Phoniatrics Vocology 30(3), 2005, pp. 85-191.
[7] C. T. Herbst, W. T. Fitch, J. G. Svec, Electroglottographic wavegrams: a technique for visualizing vocal fold dynamics noninvasively, J. Acoust. Soc. Am. 128, 2010, pp. 3070-3078.
[8] M. Modrzejewski, E. Olszewski, P. Stręk, W. Wszołek, J. Zielińska, Effectiveness of classical chordectomy in the treatment of cancer of the glottis, Auris Nasus Larynx 25(1), 1998, 59-66.
[9] M. Rothenberg, A Multichannel, Electroglottograph, Journal of Voice 6, 1992, pp. 36-43.
[10] M. Rothenberg, J.J. Mahshie, Monitoring vocal fold abduction through vocal fold contact area, J. Speech Hear Res. 31, 1988, pp. 338-351.
[11] J. Zielińska, Diagnoza i terapia sprawności ortofonicznej dzieci z uszkodzeniem słuchu wspomagane techniką komputerową (in Polish), Wyd. Naukowe AP, Kraków, 2004.


