1443 阅读 2020-02-20 14:58:24 上传
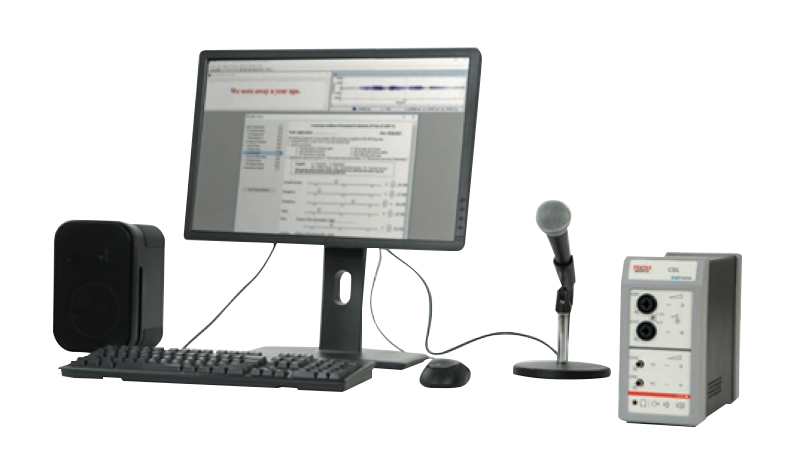
looks at formant frequencies the LPC and format history functions of CSI or multi speech in the voice lab when you begin this lab you will need to go to the computer where that program is installed the lab GA will help you open it and when it arises you'll see something that looks like this there might be a couple of other windows might be a little bit different dimensions,basically you will have two windows.one of which you will record into the other which will you use for your analysis as you begin your first step is to click on options-capture,this is to verify that your capture settings,at for the session that you are just going to do there please for me that you are a selected channel one,it is active sampling rate is eleven twenty five kilo Hertz.that your sample duration is eight seconds you do not want to trigger you do not want to click on single passer scrolling display and your input ice will be pre configured and it will probably read something like csl and all of those things are verified click on ok, and you are not ready to begin with this program you'll record by clicking the record button when you stop by cooking a stop button that will appear about where my cursor is right now or by pressing the space bar ,your first task is to record a sequence of spoken vowels,I will do that for you I click the record button.I'm click stop these little sausages represents what you just said you can listen to it by clicking the about the speaker all button if you have a longer exercise and want to get a sample from a specific location our purpose is now all we need do is click mouse in the middle of one of those utterances that's selects a specific slice we're going to do our analysis of look on the lower window to make it your.analysis window up to analysis click LPC frequency response at currsor going to draw into the lower window the LPC or freak format response at that location you can measure the frequency of those peaks looking your cursor and dragging to a peak and then reading the frequency the bar at the lower part of the window it reads two hundred and ninety hz ninety nine hz .or you can go up to the statistics window and look at form at number one and it will tell you more precisely this is actually a better way to do it.because it's oftentimes a little bit tricky to place your cursor at the exact peak.now you can simply go through and record all of these data points and we only need for the first two and those Yule log and include with your lab report when you're done click done .we're then going to go to the top window, look in the middle of another one of the vowels look on the lower window to make it active ,now right click go to window options choose a different color for the next analysis so you can tell them apart okay not apply click okay and then go up to analysis LPC frequency response and the next vowel appears in the window and you can again go to measure.now notice that this one isn't as keen,ask the previous one was and that could be for a lot of reasons it might be that I didn't form the vowel as well.we can experiment just by moving the cursor to a different location,trying again and see if we can get a sharper peak.I forgot to click on the lower window and there we do now you can see that we've got a peek cheek that are more clearly differentiated we can go to our statistics yeah I looked to see where they are and just as should happen the first format went up in frequency ,second format went down in frequency.so that's your procedure for this phase of the exercise the second phase of the exercise will be in a second video when you are done with this phase,click on file and save.if you are audio file in the format of your last name and the lab number and since there are going to be two files that you're saving called this one lab three a enter for save,that will be saved now.you can then also go to the blower window,go to file and print save graphic images,save the image in the active window and you can again sat assign a name to that save it in the folder copy it to your thumb drive and embed that please in your lab report continue now with the second video in this sequence.


