
3320 阅读 2020-03-19 10:57:36 上传
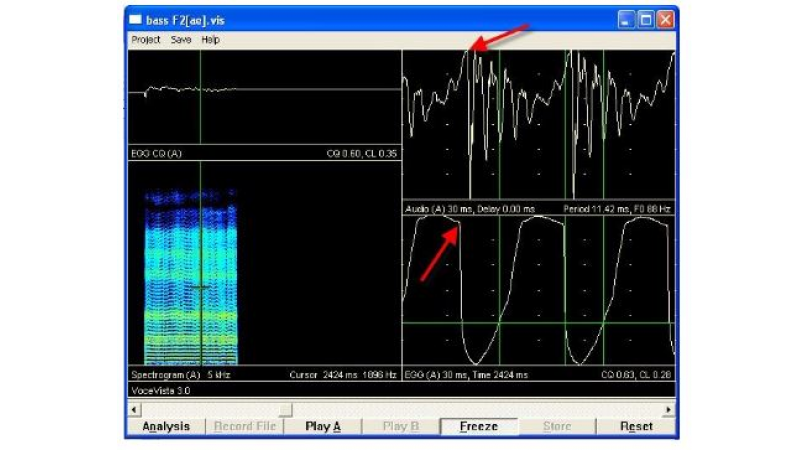
OK, So in this video I'm going to show you the current state of the EGG feature for VoceVista Video Pro.I'm going to start by opening a test file that contains audio data and EGG data,and the first thing I want to do is go to the recording settings and look at the channel display,so by default when you open a file that you have never opened before it shows the mix Theory content that means the EGG channel and the audio channel will be mixed together,and if we do actually have EGG data then we wanna see it separately, so I'm going to set here EGG left in Audio right because that's how this file was recorded and then the next thing is to go to the View menu and turn on the short-term audio and EGG view.so now if I click with a mouse anywhere, I can see my EGG at the bottom, and the audio data at the top.Now I'm going to turn off the spectrum here to make it slightly easier to see.now I can use the mouse wheel or if I have a touch pad I can use the two finger scroll gesture here,to increase the time zoom of the EGG data.In as you can see the EGG is normalized in time. so they always chose the same number of periods.so here I've said it that it shows approximately three periods and you can see that the pitch of the singing here changes but the EGG shows the same number of periods. that's using an algorithm developed by Christian helps which will later be used to display the wave Graham that he has developed.so I'm going to play this file.now in the EEG window we see a green line and a white line ,the green line is the actual IgG waveform normalized,so that it always fits here ,no the white line is the EGG and the green line is the derivative of the EGG,and what we're interested in is the maximum and the minimum of this within one period.and you can see there's a very faint magenta line here to show the maximum and then there's this thin blue line to show the minimum.and this distance is what we use to calculate the contact quotient. so,you can see here these two grey lines they mark one period and then the distance between these two lines marks the time between the maximum and the minimum, and then we use that to calculate the closed quotient. so as you can see here in this file it doesn't change that much but you can see how it's calculated. so that's pretty much it what we have for now getting this to work is actually quite a lot of number crunching behind the scenes, but it looks very simple and this normalized EGG will later be used to display the wave gram which will be shown up here.