1. 问卷研究存在的问题:endogeneity bias 内生性问题
关于内生性问题的描述,比较早看到的是2010年Antonakis等人的一篇文章:On making causal claims: A review and recommendations (Antonakis et al., 2010);这篇文章中作者比较全面的解释了什么是因果推断,以及如何进行正确的因果推理:
1.1 什么是因果
因果推断必须满足三个条件:即因在前果在后,X与Y存在相关,XY的关系不能被其它因变量解释。
Three classic conditions must exist so as to measure this effect (Kenny, 1979):
1.x must precede y temporally
2.x must be reliably correlated with y (beyond chance)
3.the relation between x and y must not explained by other causes
在工业组织相关领域研究中,前两个条件比较容易满足。这也是为什么很多期刊不再接收单个时间点数据文章的原因之一。第三个条件比较难以满足,这与我们提到的endogeneity 问题相关(i.e., that x varies randomly and is not correlated with omitted causes)有关。
1.2因果推断的黄金标准-实验研究
因果关系的黄金法则:随机实验研究the randomized field experiment
关于实验法,心理学从本科就在讲,而且有很多可以阅读的资料,本文不再赘述。如果想了解工业组织或者管理学领域关于实验研究的文章,可以读读以下几篇,尤其是Podsakoff, 这位大牛想必大家在方法领域CMV等应该很熟悉了。
Experimental designs in management and leadership research: Strengths, limitations, and recommendations for improving publishability (Podsakoff & Podsakoff, 2019). 这篇文章详细介绍了三种不同的实验研究:实验室实验,田野实验,准实验,各自的优缺点比较及相关的实证研究。
另外一篇文章是详细介绍field study 的 (Eden, 2017),这篇文章系统介绍了各种field experiment.
Eden, D. (2017). Field experiments in organizations. Annual Review of Organizational Psychology and Organizational Behavior, 4, 91–122.https://doi.org/10.1146/annurev-orgpsych-041015-062400
1.3 因果推断不一致的原因
Antonakis 等人介绍了7种造成估计不一致的原因:
1.4 非实验研究推断因果关系的方法
对于非实验研究,Antonakis 等人2010介绍了6种可以推断因果关系的方法:
如果想要了解可以阅读原文。
JOM 2019年 的一篇editorial commentary,作者同样提出了多种方法:
两篇文章共同指出一种是Instrumental variables, 这也是本篇推文要重点大力介绍的。
1.5 内生性问题endogeneity bias/issues
Sajons 2020年LQ的文章解释的比较清楚。
当一些变量是观测/测量而非操作的变量,如知觉/态度/情绪/行为,(这些变量往往在心理学及组织行为或者管理学的研究中具有重要地位)。然而,使用这些变量来估计其对结果变量的影响通常是有问题的,因为这些变量与其它变量或存在共同的变因(common causes),即内生性问题endogeneity.
以实例来说明。
比如我们想要研究公平感x对于员工绩效y的影响。
常数项,回归系数即误差组成。
如果我们想要说确实x影响cause y而非其它变量导致,我们需要x具有外生性exogenous, 即x与误差项e无关。如果x不具有外生性(exogenous), 它与误差项产生共变(如x增大,e增大),我们就说x存在内生性问题 (Sajons, 2020)。
1.6 内生性主要成因:omitted variables
Omitted variables are variables, which impact both the explanatory and dependent variables, but which are not controlled for in a regression. Therefore, in the presence of omitted variables, explanatory and dependent variables share unknown or unaccounted for common causes.
缺失变量指的是哪些在回归模型中没有纳入,但对于自变量和因变量产生影响的变量,在这种期刊下预测变量和结果变量存在无法解释的共因。
2. 工具变量模型
2.1 什么是工具变量模型 instrumental variable estimation
所有读的文献里Sajons 2020的文章对于我这种非统计专业是最为友好也解释最为清楚的一篇。首先,工具变量模型早期在经济学里比较普遍,这几年心理学领域越来越受到追捧。
潜在的逻辑是:利用x 预测变量的外生部分的变异去估算其对结果变量y的影响。说直白一点就是如果x受到其它变量的影响,那么把这部分被影响给去掉,只用它被“提纯” 的部分去看对结果变量的影响。也许看到这里觉得有点异想天开,我们不禁要问,那如何找到这些“不纯的部分”,自变量可能受到的影响太多了……
工具变量模型就是要找到这样一些变量z导致了x的变化,但是并不会受到缺失变量的影响。因此,工具变量必须要满足以下三个条件Technically, this so-called “instrument” z must fulfill three conditions (Angrist & Krueger, 2001; Angrist & Pischke, 2008; Antonakis et al., 2010; Kennedy, 2008; Wooldridge, 2012)
https://www.bilibili.com/video/BV1Sk4y1d76N/
接下来的问题就是哪些变量可以做工具变量。
2.2 常见的工具变量
人口学基本 信息,人格和认知能力都可以作为工具变量。
Typically, stable individual difference that are demographic information, personality, and cognitive ability could be used as instrumental variables (Antonakis et al., 2010; (Hughes, Lee, Tian, Newman, & Legood, 2018). Larcker and Rusticus (2010) suggested that cognitive ability is more suitable as an instrumental variable than personality (Hughes et al., 2018).
如大五人格;
Research by D’Zurilla, Maydeu-Olivares, and Gallardo-Pujol (2011) suggests that the Big Five personality factors (e.g., Goldberg, 1993) may be suitable instruments (i.e., they may be strong predictors of positive and negative problem orientation). (Maydeu-Olivares et al., 2020)
其它一些比如区域产量?Adopting a logic already introduced in political economics (e.g.,
Bentzen et al., 2017; Buggle, 2018; Nunn & Qian, 2011), I use a geographical variable measuring the potential productivity of agriculture as the main instrument (Lonati, 2019).
具体使用的例子可以看(Lonati, 2019), 2019 LQ, 这篇还有2020年psychological Methods, Maydeu-Olivares 等人的一篇。
工具变量的样本量问题:extant research (e.g., Bollen, Kirby, Curran, Paxton, & Chen, 2007) suggests that in small samples (N < 200) instrumental variable methods are most accurate (less biased).
3. 工具变量模型在统计软件中的实现
3.1 SPSS
2020年的时候Daryanto 开发了一个spss插件,下载就能用,很方便。
优势:借助SPSS, 操作简单,结果解读很容易,提供了工具变量回归模型的操作及两个例子。文章简短。且结果提供工具变量诊断检验的三种方法:Hausman’s specification tests, overidenti- fying restriction tests and weak instrument tests。
不足:只能放入一个结果变量,对于结构方程模型,当涉及多个结果变量的时候无法处理。
EndoS:An SPSS macro to assess endogeneity (Daryanto, 2020)
举例子:教育程度能否预测一个人的收入?工具变量为年龄,父母受教育程度。
安装好插件之后,analyze-regression, Endos_, 选择自变量因变量,工具变量,在options选择三种工具变量的诊断方法,即工具变量是不是一个好的工具变量。
3.2 R
2020年Psychological Methods 第2期的一篇文章介绍了工具变量模型在结构方程模型当中的运用,这篇文章解决了前边SPSS插件只能选择一个结果变量的问题。工具变量回归模型需要满足两个基本假定前提:(a) 线性 (b) 方差齐性
研究问题:创新绩效预测企业市场份额?
使用的是R 包,(AER);
例子:market 和innovation performance
简单演示一下,我在自己运算的时候发现作者提供给的数据和代码有一些问题,尤其是文件命名,因为提供csv文件数据Mplus, 而且文件里没有变量名称,如果直接跑会出错,根据提供的Mplus代码可以查看变量名。
在设置好工作路径之后,导入数据,命名为data, 然后对四个变量进行简单的描述性统计
涉及的四个变量mst: market share, perf = innovation performance, mo = market orientation; degree = innovatio degree;
> ### IMPORT THE DATA ###
> data<-read.csv("mo.csv")
> data<-read.delim("mo.txt")
> summary(data)
> library(AER)
> nt<- ivreg(mst~ perf|mo+degree,data=data)
> summary(nt, df = Inf, diagnostics = TRUE, test = "Chisq")
> ### OPTION 2: RUN THE ADF 2SLS MODEL ###
> adf<-ivreg(mst~ perf|mo+degree,data=data)
> summary(adf, df = Inf, vcov = sandwich, diagnostics = TRUE, test = "Chisq")
> ### OPTION 3: RUN THE NORMAL THEORY ML MODEL ###
> model<- "mst~perf
+ perf~mo
+ perf~degree
+ mst~~mst
+ perf~~perf
+ mo~~mo
+ degree~~degree
+ mo~~degree
+ perf~~mst"
> fit <- cfa(model,data=data,estimator="ML")
> summary(fit)
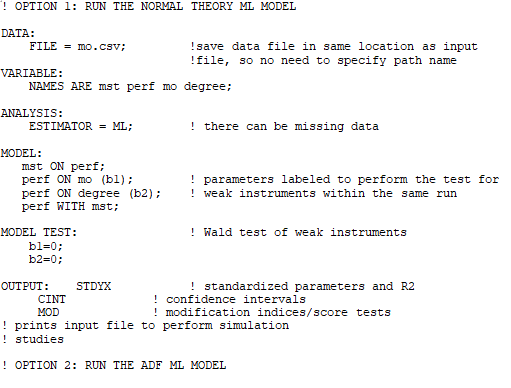
3.3 Mplus
代码来源:http://dx.doi.org/10.1037/met0000226.supp
Mplus Syntax
3.3 学习资料
R 相关
虽然PM的那篇文章提供了R代码,但是对于AER 不熟悉的还是不太能理解,这儿有一本R书籍专门有一部分介绍了工具变量;
https://www.econometrics-with-r.org/12-1-TIVEWASRAASI.html
Mplus
然后就是Zyphur 2019年的教学视频,可能对具体操作帮助不大因为他提供的代码太简单了,只是估计模型拟合并未提供如何去进行对于工具变量诊断。但是对于工具变量的原理讲解很清楚。
Maydeu-Olivares, A., Shi, D., & Fairchild, A. J. (2019). Estimating Causal Effects in Linear Regression Models With Observational Data: The Instrumental Variables Regression Model. Psychological Methods,
参考文献
Antonakis, J., Bendahan, S., Jacquart, P., & Lalive, R. (2010). On making causal claims: A review and recommendations. Leadership Quarterly.https://doi.org/10.1016/j.leaqua.2010.10.010
Daryanto, A. (2020). EndoS: An SPSS macro to assess endogeneity, 16(1), 56–70. https://doi.org/10.20982/tqmp.16.1.p056
Eden, D. (2017). Field Experiments in Organizations. Annual Review of Organizational Psychology and Organizational Behavior, 4(1), 91–122.https://doi.org/10.1146/annurev-orgpsych-041015-062400
Hughes, D. J., Lee, A., Tian, A. W., Newman, A., & Legood, A. (2018). Leadership, creativity, and innovation: A critical review and practical recommendations. The Leadership Quarterly, 29(5), 549–569.https://doi.org/10.1016/j.leaqua.2018.03.001
Lonati, S. (2019). What explains cultural differences in leadership styles? On the agricultural origins of participative and directive leadership. The Leadership Quarterly, 101305. https://doi.org/10.1016/j.leaqua.2019.07.003
Maydeu-Olivares, A., Shi, D., & Fairchild, A. J. (2020). Estimating Causal Effects in Linear Regression Models With Observational Data: The Instrumental Variables Regression Model. Psychological Methods,25(2),243–258. https://doi.org/10.1037/met0000226
Podsakoff, P. M., & Podsakoff, N. P. (2019). Experimental designs in management and leadership research: Strengths, limitations, and recommendations for improving publishability. The Leadership Quarterly, 30(1), 11–33. https://doi.org/10.1016/j.leaqua.2018.11.002
Zyphur, M. (2019): Mplus Workshop at The University of Melbourne, February 4-8, 2019 (5 Days)... University of Melbourne. Media. https://doi.org/10.26188/5c7d2920b59ed


